Willem Hoek
Solving the Jane Street Puzzle of February 2020; Python vs Ocaml
Apr 03, 2020

Piet Mondrian, Composition with Large Red Plane, Yellow, Black, Gray, and Blue, 1921
Single-Cross
Every month, Jane Street Capital post a puzzle on their website. This was the puzzle for February 2020. [1]
A random line segment of length D is chosen on a plane marked with an infinite checkerboard grid (i.e., a unit side length square grid). What length D maximizes the probability that the segment crosses exactly one line on the checkerboard grid, and what is this maximal probability?
I have been following the Jane Street puzzles for years. I normally try to solve the puzzle in one sitting. So, I try to get to the solution as quick as possible, whatever it takes. This month was no different – resulting in quite a scrappy solution – but it got my name on the “Correct Submissions” list!
Approach
To visualise the problem, start by drawing the checkerboard with unit side length and draw some sample segments (example a to f in figure 1 below) to see how many lines it crossses. Segments c, d, and f are crossing only one grid line and sements a, b, and e are not, as they are crossing either none or more than one line.
For my example – I started drawing all the segments from the yellow square and noticed that if the end of the segment is in one of the green blocks, it crossed exactly one line. Also, I realised that if I can solve the problem for all segments that originates in one square, the solution will apply for the infinite checkerboard.
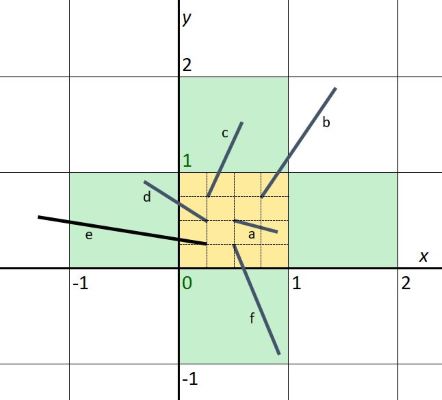
Figure 1 - Sample segments drawn on a unit side length square grid
Initially I tried to solve the problem purely with maths (pen and paper) but decided I could get to the answer a lot quicker by simulating the segments programatically - using a Monte Carlo type method.
The program needs to simulate a representative subset of infinite segments by calculating the probability (P) for a range of lengths (D). The more segments in the simulation, the more accurate the answer will be.
For the simulation, one end of every segment was on a grid between coordinates (0,0) and (1,1) - the yellow square in figure 1. The grid had xn by xy nodes. And for every node sn segments were evaluated. Therefore for every length D,xn * yn * sn segments were used in the simulation.
Table 1 - Results of the benchmark simulation for segment lengths between 0 and 2.3
  length   probability     one_line      segments    xn    yn    sn
 --------- ----------- ------------ ------------- ----- ----- -----
  0.000000    0.000000            0    12_000_000   200   200   300
  0.100000    0.120455    1_445_466    12_000_000   200   200   300
  0.200000    0.228822    2_745_865    12_000_000   200   200   300
  0.300000    0.324577    3_894_919    12_000_000   200   200   300
  0.400000    0.407189    4_886_268    12_000_000   200   200   300
  0.500000    0.477155    5_725_858    12_000_000   200   200   300
  0.600000    0.534541    6_414_495    12_000_000   200   200   300
  0.700000    0.579312    6_951_744    12_000_000   200   200   300
  0.800000    0.610924    7_331_089    12_000_000   200   200   300
  0.900000    0.630141    7_561_688    12_000_000   200   200   300
  1.000000    0.636667    7_640_002    12_000_000   200   200   300  <= max probability here
  1.100000    0.577093    6_925_116    12_000_000   200   200   300
  1.200000    0.489676    5_876_109    12_000_000   200   200   300
  1.300000    0.401547    4_818_563    12_000_000   200   200   300
  1.400000    0.319446    3_833_352    12_000_000   200   200   300
  1.500000    0.248938    2_987_251    12_000_000   200   200   300
  1.600000    0.188646    2_263_750    12_000_000   200   200   300
  1.700000    0.136425    1_637_102    12_000_000   200   200   300
  1.800000    0.090862    1_090_342    12_000_000   200   200   300
  1.900000    0.050560      606_718    12_000_000   200   200   300
  2.000000    0.014558      174_693    12_000_000   200   200   300
  2.100000    0.001916       22_990    12_000_000   200   200   300
  2.200000    0.000029          348    12_000_000   200   200   300
  2.300000    0.000000            0    12_000_000   200   200   300
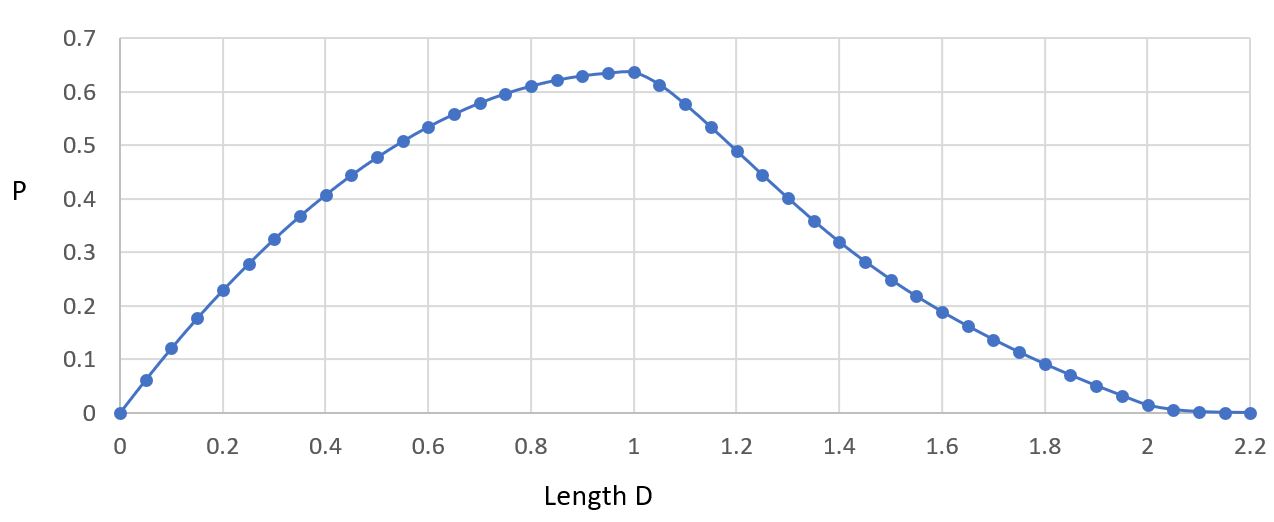
Figure 2 - Probability for different segment lengths
As can be seen from results, the maximum probability is where length D is ~1. Further testing - with smaller increments - shows that the optimal length D was exactly 1. In order to increase the accuracy of the probability calculation for D = 1, the nodes and number of segments per node were increased in the simulation.
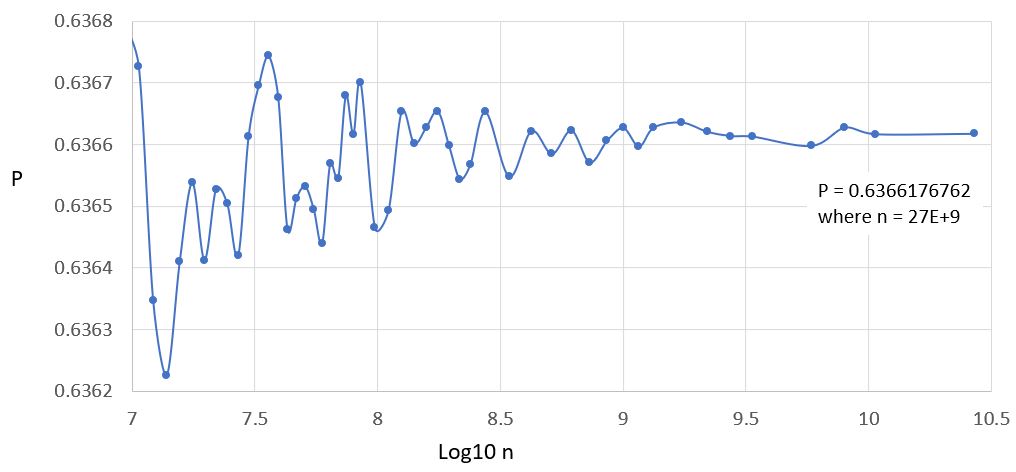
Figure 3 - Probability for number of segments used in simulation, where D = 1
Entry submitted:
The maximum probability is 0.6366 where D = 1.
UPDATE: As per solution posted by Jane Street - the answer is 2/PI (or about 0.63661977)
Python vs OCaml vs JavaScript
The first program was created in Python and runtime for the benchmark program, to create numbers for table 1, was over 3 minutes! The runtime of the Python program decreased significantly after using the Numba library - more about that further on.
Not happy with the initial execution speed, I decided to re-write the program in a compiled language. Since Jane Street is using OCaml extensively, I thought it would be fitting to try out OCaml for this toy program. The OCaml program executed in well under 3 seconds.
The OCaml program was created line-for-line from the Python program, resulting in a very imperative style program. This is due to the use of for and while loops and the use of mutable data structure ref. As a side note, in CS courses that are using OCaml, the use of mutable data structures ref and array are not allowed.
let hit x y =
  (x < 0. && x > -1. && y > 0. && y < 1.) ||
  (x > 1. && x <  2. && y > 0. && y < 1.) ||
  (y < 0. && y > -1. && x > 0. && x < 1.) ||
  (y > 1. && y <  2. && x > 0. && x < 1.)

let print_header () =
  Printf.printf "\n";
  Printf.printf "  length   probability     one_line      segments    xn    yn    sn\n";
  Printf.printf " --------- ----------- ------------ ------------- ----- ----- -----\n%!"

let print_stats hit_count total_count length xn yn sn =
  Printf.printf "%10f %11f" length  (float_of_int hit_count /. float_of_int total_count);
  Printf.printf "%#13i %#13i %5i %5i %5i\n%!"  hit_count total_count xn yn sn

let pol2cart length sigma =
  (length *. cos sigma, length *. sin sigma)

let calculate xn yn sn length =
  let pi2 = 2. *. 3.1415926535897931 in
  let total_count = ref 0 in
  let hit_count = ref 0 in
  for s = 0 to (sn - 1) do
    let sigma = float_of_int s *. pi2 /. float_of_int sn in
    let dx, dy  = pol2cart length sigma in
    for x = 0 to (xn - 1) do
      let x_start = float_of_int x /. float_of_int xn in
      for y = 0 to (yn - 1) do
        let y_start = float_of_int y /. float_of_int yn in
        let x_end = x_start +. dx in
        let y_end = y_start +. dy in
        if hit x_end y_end then incr hit_count;
        incr total_count
      done;
    done;
  done;
  print_stats !hit_count !total_count length xn yn sn

let () =
  let length = ref 0.0 in
  let incr = 0.1 in
  print_header ();
  while !length < 2.300001 do
    calculate 200 200 300 !length;
    length := !length +. incr
  done
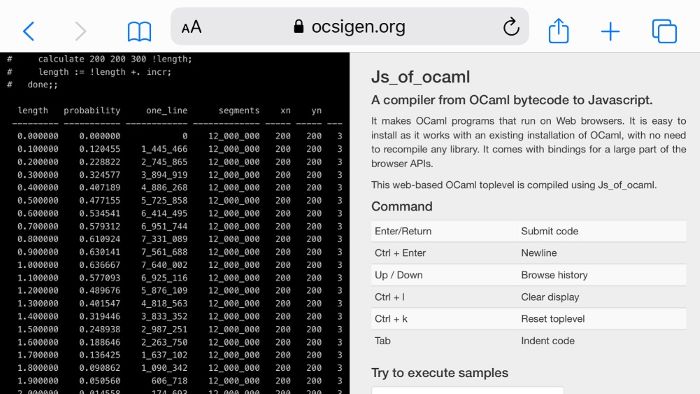
If you do not have an OCaml compiler installed, you can execute the above OCaml code directly in your browser using one of the online notebooks such as sketch.sh or Ocsigen toplevel. That means you can even run the OCaml code on your mobile phone!
Performance
The Python program was speeded up by adding the crazy-simple-to-use Numba library [5]. The runtime of Python with Numba was under 2 seconds. Very impressive! All that was required was to apply the numba.jit decorator to all the functions in the Python program.
A JavaScript version was created by compiling the OCaml to JavaScript. Two options exists, either js_of_ocaml library if you have OCaml installed or BuckleScript, that will install a forked version of OCaml. For the very basics on how to use js_of_ocaml, see my HOWTO create a JavaScript file from Ocaml post. [3]
The OCaml programs were tested on Windows and Linux.
Table 1 - Benchmarks
| Program [2] | Details | Runtime (s) | x times slower |
|---|---|---|---|
| loop.py | Python, Windows | 181 | 113 |
| loop_numba.py | Python with Numba @jit(cache=True), Windows |
1.6 | 1 |
| loop.ml | OCaml native, Windows | 2.5 | 1.5 |
| loop.ml | OCaml bytecode, Windows | 26.1 | 16 |
| loop.ml | OCaml native, Linux (VM) | 5.3 | 3.2 |
| loop.ml | OCaml bytecode, Linux (VM) | 51 | 32 |
| loop.js | JavaScript, js_of_ocaml, Node on Windows | 2.8 | 1.7 |
| loop_bs.js | JavaScript, BuckleScript, Node on Windows | 3.2 | 2 |
| loop.js | JavaScript, js_of_ocaml, Node on Linux (VM) | 12.7 | 8 |
Notes:
- These benchmarks should be taken with a pinch of salt. My objective was to get to a solution as soon as possible which resulted in very inefficient code
- Reported runtimes were the median of five runs
- All programs were developed and tested on a Lenovo X1 Extreme laptop running Windows 10 with Intel Core i7-8750H CPU @ 2.20GHz
- Program versions: Python 3.7.1, OCaml 4.10.0, js_of_ocaml 3.5.2, BuckleScript 7.2.2, Numba 0.48.0, Node 12.16.1, Linux - Pop!_OS 19.10 (Ubuntu) running in VMWare 15.5.1 Player
- For OCaml on Windows, used the 64-bit graphical installer [5] which is based on Cygwin
- Benchmark code available in the Github repo [2]
- For the Python Numba version, adding
cache=Trueto the decorator, reduced the runtime by 0.4 seconds
Observations:
- The Python program with Numba JIT compiler was the overall winner and more than 100x faster than the standard Python program
- On Windows, the OCaml native and the two JavaScript programs had very similar execution times
- Execution times on VMware Player Linux were ~2x slower than on Windows
This was a lot of fun. Thanks to Jane Street Capital for posting the puzzle.
References
[1] Jane Street - Puzzle Archive.
https://www.janestreet.com/puzzles/archive/. Retrieved: 2020-04-03
[2] Source code for this post on Github.
https://github.com/whoek/janestreet-puzzles/tree/master/2020-02. Retrieved: 2020-03-01
[3] HOWTO: Create a JavaScript file from OCaml.
https://willemhoek.com/b/Create-a-JavaScript-file-from-Ocaml
[4] OCaml website.
https://ocaml.org/. Retrieved: 2020-03-01
[5] OCaml for Windows - Graphical Installer
https://fdopen.github.io/opam-repository-mingw/installation/. Retrieved 2020-02-29
[6] Numba - open source JIT compiler that translates a subset of Python code into fast machine code
http://numba.pydata.org/
Similar Posts on this website
How-to Import an Excel file into SQLite and back to Excel again
Solving the Jane Street puzzle of December 2022
Why I created Scrumdog - a program to download Jira Issues to a local database
Jane Street puzzle Feb 2021 SOLVED! OCaml to the rescue
Solving the Jane Street puzzle of Dec 2020 - Backtracking with OCaml
Automate your Jira reporting with Python and Excel